Topic: DMD0293

Using the Trend View
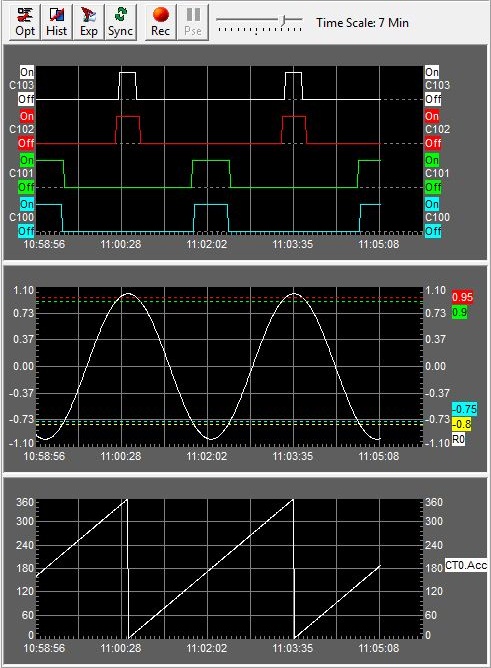
Once a Trend View has been created and it's display options have been configured, the Trend will begin collecting data for each of the controller elements on each of the panes and displaying that data in graphical form in the Trend View's moving graph. Refer to the Trend View below for some things to be aware of when using Trend Views:
Discrete points, integer values and floating point (Real) values are placed in separate panes.
Variables are graphed using solid horizontal lines.
Constants are graphed using dotted horizontal lines.
Red vertical lines indicate a loss of communication.
Blue vertical lines indicate communication is established.
The Crosshair Cursor
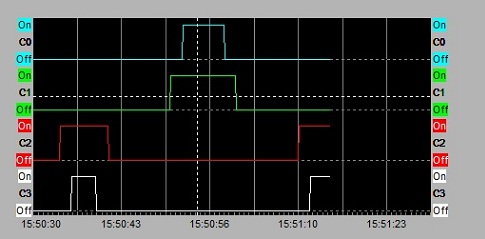
The crosshair cursor is displayed anytime the mouse cursor moves over any of the panes in a Trend View. If there are multiple Panes in the Trend View, the vertical bar of the crosshair will extend through all of them. The crosshair provides a visual reference when comparing values displayed on the Panes of a Trend View.
Note: the crosshair cursor can be disabled in the Trend View Options.
Using the Crosshair Zoom In / Out
Using the CTRL key and the scroll wheel
on the mouse will put the Trend View into Historical
Mode and zoom into or out of the area under the center of the crosshair
as follows:
-
CTRL + scrolling upward will zoom into the area by decreasing the Time Scale
-
CTRL + scrolling downward will zoom out of the area by increasing the Time Scale
Using the Crosshair to Snapshot Data
Left-clicking the mouse over the Trend View will take a snapshot of all the values on all of the Panes on the Trend at the time where the cross hair was located, then present that data on the snapshot dialog.
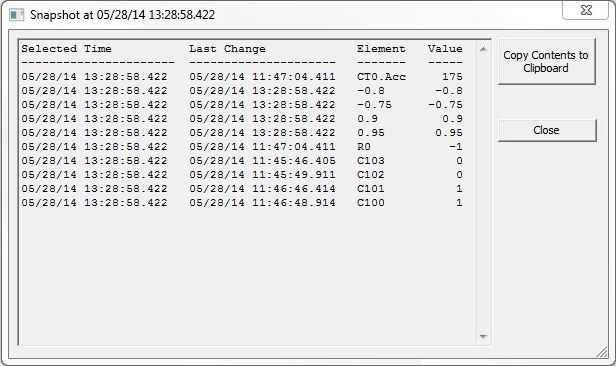
Clicking the Copy Contents to Clipboard button will copy the data displayed on the snapshot dialog to the Windows clipboard, which can then be pasted into any other Windows application for further processing.

Clicking this button opens the Trend View Options dialog to specify the controller elements that will be included in the Trend and to choose how those elements will be displayed on the Trend. When this button is clicked, the last pane that had focus will be selected (highlighted) when the Trend View Options menu comes up.

Clicking this button stops the real-time (live) update of the moving graphs in the Trend, and adds a scroll bar to the bottom of the Trend that allows the user to scroll backwards in time through all of the data that is currently stored for each of the data points on the moving graphs. The data gathering for each data point on the Trend will continue while the Trend View is in Historical mode.
When the Trend View is in Historical mode the Trend name in the tab will also display [HISTORICAL].
Clicking the button again will re-enable the real-time (live) update of the moving graphs, which will be updated with all of the data that was gathered while the displays were in Historical mode.

Clicking this button will open a series of dialogs that are used to export all of the collected data points or only the data points between two user-selected time stamps on the Trend View. The selection that you make on the following dialog will depend on what application will be using the exported data:
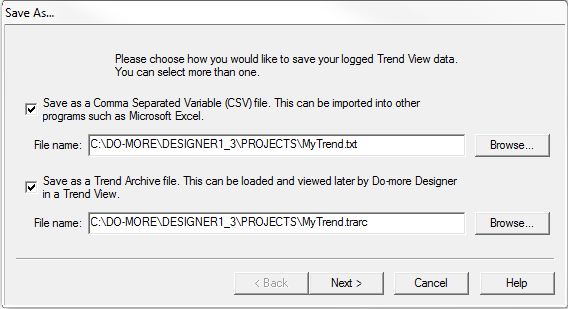
Save As a Comma Separated Variable (CSV) file.
The contents of this file can be imported into a third party application like Microsoft Excel. This file will contain only the collected data values for all of the elements on all of the Panes in the Trend View.
File Name - selects the name of the file in which to store the exported data. The filename and destination folder can be changed by manually entering the text or clicking the "Browse ..." button and navigating the resulting File Open dialog.
Save As a Trend Archive file (TRARC) file.
The contents of this file can be imported into a separate instance of Do-more Designer. This file will contain the Trend View configuration, all of the data collected for all of the elements on all of the Panes in that Trend View, and any other project components that are required to reconstruct and display the Trend View in another Do-more Designer project.
Note: use File-> Import-> Trend Archive Into New Project... to create a new offline Do-more Designer project, reconstruct the Trend View, then import all of the exported data into that Trend View.
File Name - selects the name of the file in which to store the exported data. The default extension for the file is ".trarc". The filename and destination folder can be changed by manually entering the text or clicking the "Browse ..." button and navigating the resulting File Open dialog.
Click the Next button to specify the Export Options selection dialog:
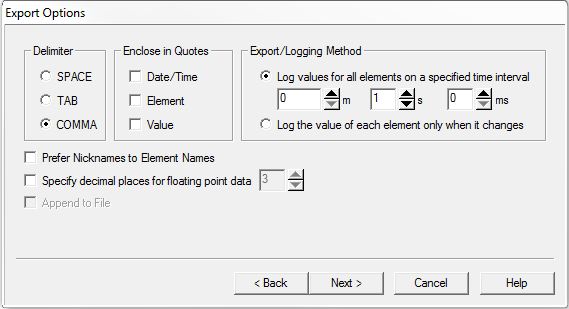
Delimiter - designates what character will be used to separate the individual elements on each exported line of data. The default is a comma between each element on a line.
Enclose in Quotes - designates which elements need to be enclosed in double-quotes
Date/Time - enclose both the Date and the Time in double quotes, for example: "2010/9/3","09:36:43.456",Heat_PID.PV,0.35
Element - enclose only the Element in double quotes, for example: 2010/9/3,09:36:43.456,"Heat_PID.PV",0.35
Value - enclose only the Value in double quotes, for example: 2010/9/3,09:36:43.456,Heat_PID.PV,"0.35"
Export/Logging
Method - specifies the format of the exported data
-
Log values for each element on a specified time interval - generates an entry in the output file for all of the values in the Trend View at the specified time interval. Use the Minute / Second / Millisecond fields to specify the time interval.
-
Log the value of each element only when it changes - generates an entry in the output file for a single element each time that it changes value.
Prefer Nicknames to Element Names - if the elements being exported have nicknames assigned to them, the nicknames will be in the export file instead of the element. For example, if C13 has the nickname "Low Low Alarm", the exported lines for this data point would be "2010/9/1","12:02:54.819","Low Low Alarm","off"
Specify decimal places for floating point data - enabling this selection and selecting one of the values from the list (0 - 10) will export all floating point numbers with the selected number of decimal places.
Append to File - specifies whether to append the export data to the file, saving the existing contents of the file, or to over-write the existing contents in the specified file. This option will be enabled automatically any time the specified file already exists.
Click the Next button to specify the Time Range selection dialog:
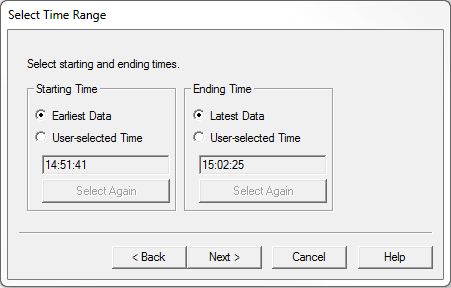
Select Time Range - designates how much data to export, this can be either all of the data accumulated since the Trend View was opened, or a range specified by a start time and an end time.
Start Time - specifies the beginning of the data to export
-
Earliest Data - start exporting from the beginning of when the Trend View started accumulating the data points
-
User Selected Time - start exporting data from the time specified by using the scroll bar to move the trend to the desired time and left-click on the trend to set the time. The left-click will place a vertical bar on the trend with a 'S' at the top denoting the start time.
-
Select Again - will remove the current Starting Time and allow the selection of a different Starting Time
Ending Time - specifies the end of the data to export
-
Latest Data - export all of the data the Trend View has accumulated since it was opened
-
User Selected Time - stop exporting data at a time specified by using the scroll bar to move the trend to the desired time and left-click on the trend to set the time. The left-click will place a vertical bar on the trend with an 'E' at the top denoting the ending time.
-
Select Again - will remove the current Ending Time and allow the selection of a different Ending Time
Click the Next button to confirm your previous selections:
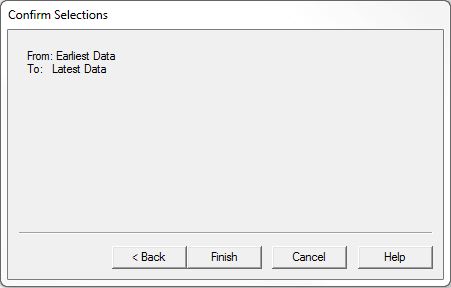
Confirm Selections - will display the range of data points to export to the file.
click Back to return to the previous dialog to change the export options
click Finish to perform the export operation
click Cancel to abort the export operation
Below is a sample of what the exported data will look like with the default export options:
2012/06/05,13:52:37.047,Heat_PID.PV,0.35
2012/06/05,15:48:02.160,Heat_PID.SP,0.62
2012/06/05,13:35:23.088,Heat_PID.Bias,0.035
2012/06/05,13:39:19.472,Heat_PID.Output,0.73
2012/06/05,12:02:54.819,C10,off
2012/06/05,12:02:54.819,C11,off
2012/06/05,12:02:54.819,C12,off
2012/06/05,12:02:54.819,C13,off
Synchronize with Other Trend Views or PID Views
Is used to synchronize the time frame and the starting time stamp of multiple PID Views and/or Trend Views so that all synchronized views will display the same start time and the same amount of time.

Click the Sync button to display a list of the available PID Views and Trend Views.
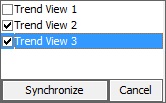
Select the Views from the list that are to be synchronized with the current view then click the Synchronize button.
During a data recording session, values for all of the Elements on all of the Panes in the Trend will be collected. At the end of the recording session these values can be written as comma separated variables to a text file.
Begin Recording

Stop Recording


Click this button to stop recording data while the button is depressed. The button will appear depressed and [RECORDING - PAUSED] will be displayed in the Trend View's tab. Click the button again to continue recording data, or click the Stop button to stop the recording session completely.
Click this button to begin the recording session. The button face will change to Stop with a black square icon, and [RECORDING] will be displayed in the Trend View's tab. Click this button again to stop the recording. At this point a 'Save As' dialog will prompt you for the filename in which to save the recorded data values. The selection that you make on the following dialog will depend on what application will be using the saved data:
Save As a Comma Separated Variable (CSV) file.
The contents of this file can be imported into a third party application like Microsoft Excel. This file will contain only the collected data values for all of the elements on all of the Panes in the Trend View.
File Name - selects the name of the file in which to store the exported data. The filename and destination folder can be changed by manually entering the text or clicking the "Browse ..." button and navigating the resulting File Open dialog.
Save As a Trend Archive file (TRARC) file.
The contents of this file can be imported into a separate instance of Do-more Designer. This file will contain the Trend View configuration, all of the data collected for all of the elements on all of the Panes in that Trend View, and any other project components that are required to reconstruct and display the Trend View in another Do-more Designer project.
Note: use File-> Import-> Trend Archive Into New Project... to create a new offline Do-more Designer project, reconstruct the Trend View, then import all of the saved data into that Trend View.
File Name - selects the name of the file in which to store the exported data. The default extension for the file is ".trarc". The filename and destination folder can be changed by manually entering the text or clicking the "Browse ..." button and navigating the resulting File Open dialog.
The slider sets the overall amount of time to be displayed in the all of the Panes on the Trend.
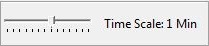
The Time Scale can be set to the following;
-
500ms
-
1 Second
-
10 Seconds
-
20 Seconds
-
30 Seconds
-
45 Seconds
-
1 Minute (the default)
-
2 Minutes
-
5 Minutes
-
7 Minutes
-
10 Minutes
-
30 Minutes
-
1 Hour
The Time scale value is set by the following methods:
-
left-clicking on the Time Scale icon at the desired interval location
-
left-clicking on the Time Scale icon at the desired interval location then use the arrow keys or the scroll wheel to decrease or increase the Time Scale value
-
left-click and hold the slider, then drag it left (to decrease) or right (to increase) the Time Scale value
-
left-clicking on the Pane then use the arrow keys or the scroll wheel to decrease or increase the Time Scale value - this will put the Trend into Historical mode.
Context-Sensitive Menu Selections
Right-clicking in the display portion of a Trend View will pull up a context-sensitive menu that contains a list of the various Trend-View-related functions. The functions that are applicable in the current context will be enabled, any selections that cannot be performed in the current context will be grayed-out.
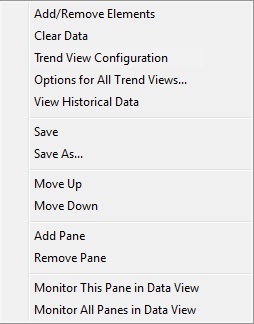
Selecting Add/Remove Elements will open the Trend View Options dialog (just like the Trend View Options button & the Trend View Options selection from this same menu) to specify the controller elements that will be included in the Trend and to choose how those elements will be displayed on the Trend. Whatever pane the mouse cursor was in when the right-click was performed to pull up the Context-Sensitive Menu, is the pane that will be selected (highlighted) when the Trend View Options menu comes up.
Selecting Clear Data will open a Clear Data dialog asking, "Do you want to clear all of the data accumulated so far?". Clicking Yes will clear all the data collected in all of the Panes in the Trend and clear the moving graphs on all of the Panes of the Trend. The Trend will then begin collecting data and plotting the new values on the moving graphs.
Selecting Trend View Configuration will open the Trend View Options dialog (just like the Trend View Options button & just like the Add/Remove Elements selection from this same menu) to specify the controller elements that will be included in the Trend and to choose how those elements will be displayed on the Trend. Whatever Trend View had focus when the right-click was performed to pull up the Context-Sensitive Menu, is the Trend View that will be selected (highlighted) when the Trend View Options menu comes up.
Selecting Options for All Trend Views... will open the Global Options dialog that can be used to set the options for all trends. Go here for a detailed description of the available options.
Selecting View Historical Data will toggle between normal display and Historical display (exactly the same as pressing or depressing of the Hist button on the toolbar (as described above). In normal display mode, selecting this will stop the real-time (live) update of the Trend displays and add a scroll bar to the bottom of the Trend panel that allows the user to scroll backwards in time through all of the data that is currently stored for each of the data points on the displays. The data gathering for each data point on the trend displays will continue while the Trend View is in historical mode.
Note: when the Trend View is in Historical
mode the tab name will have the word [HISTORICAL] added to it.
Selecting this again will uncheck it on the context-sensitive menu and
will re-enable the real-time (live) update of the trend displays and the
trend graphs will be updated with all of the data that was gathered while
the displays were in historical mode.
Save ... stores the current Trend View configuration to the currently open Trend file.
Save As ... stores the Trend View configuration to a new Trend file.
Note: the Save and Save As selections only save the Trend View configuration, they do NOT save the data values that were logged while the Trend is running. For information on saving the data values AND the Trend View configuration refer to the help topic for Export Range on creating a Trend Archive.
Move Up will move the Pane that was under the mouse cursor toward the top of the Trend View if there possible
Move Down will move the Pane that was under the mouse cursor toward the bottom of the Trend View if possible
Add Pane will add a new empty Pane at the bottom of the Trend View
Remove Pane will remove the Pane that was under the mouse cursor and all of the logged data for elements in that Pane
Monitor This Pane in Data View will create a new Data View and add all of the Elements that are in the Pane under the mouse cursor to that newly created Data View.
Monitor All Panes in Data View will create a new Data View and add all of the Elements that are in all of the Panes in the Trend View that newly created Data View.
See Also:
Using the Trend View
Related Topics: