Topic: DMD0291

Trend View Display Options
Options for this Trend View:
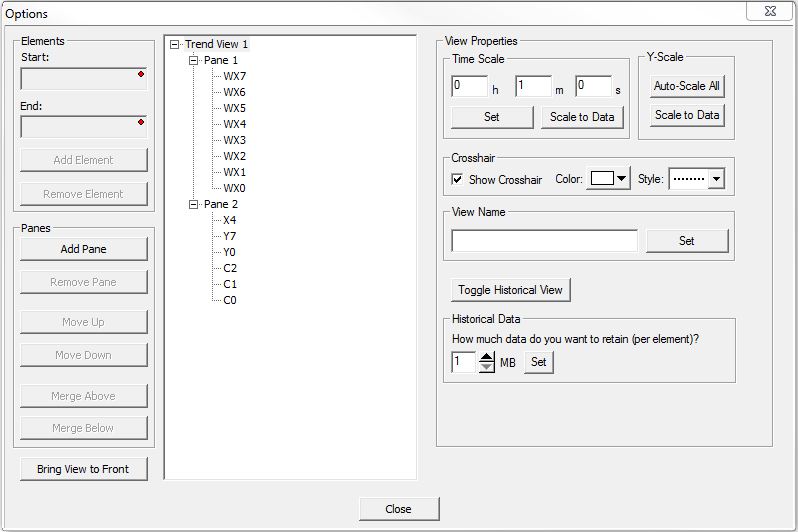
The Trend View Options dialog is used to set the display options and the data collection parameters for the currently open Trend View. Click the Opt button on the Trend Dialog or right clicking anywhere on the Trend and select Trend View Options to open the Options dialog.
Note: you can change the options for all of the currently open Trend Views and all that will be created in the future on the Trend tab of the View -> Options dialog.
Adding Elements to a Pane
The Elements group specifies which data elements to add to
the selected pane of a trend view. Each data point on a Trend consumes
13 bytes of data when it is stored, so, as a general rule, 1 Mb of memory
will retain about 65,536 individual data points. The maximum amount of
storage allowed is 10 Mb per data point. If the storage limit is reached,
the oldest data points will be replaced 32 points at a time.
A Trend can be configured to save a new data point is saved at the predetermined
time intervals, or any time the value of that point changes. Short time
intervals and data points whose values are changing rapidly will use up
the storage limit at a higher rate than longer intervals and data points
whose values are changing less often.
Note: Use the F9 key (Element Browser) or Down-Arrow key (Auto-Complete) at any time to see a complete list of the memory locations that are valid in the current field of the instruction.

Start: is the first (or only) data element to add to the pane. This can be any readable numeric location or any readable bit location of any constant value. End: optionally specifies the last data element in a range to add to the pane. This can be any readable numeric location or bit location in the same range as the Start element, or any constant value.
Click Add Element to the highlighted pane. Click Remove Element to delete the highlighted element from the pane.
Adding, Deleting, and Repositioning Panes
The Panes group controls the number of Panes and their position on the current Trend View.
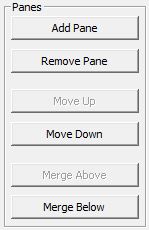
Click the Add Pane button to add a new pane to the current Trend View.
Click the Remove Pane button to delete the highlighted element from the pane.
Click the Move Up button to move the highlighted pane toward the top of the Trend View.
Click the Move Down button to move the highlighted pane toward the bottom of the Trend View.
Click the Merge Above button to combine the elements of the highlighted pane with the pane directly above it.
Click the Merge Below button to combine the elements of the highlighted pane with the pane directly below it.
Click the Bring View to Front button will make the Trend View the top tab, which will make it's contents visible.
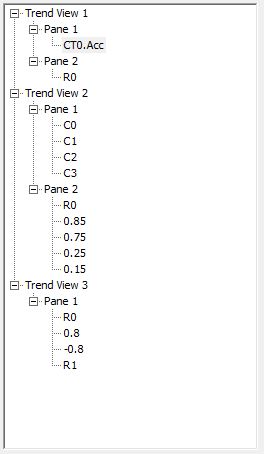
Current Trend Views and Their Panes
The center column of the Trend Options dialog displays the current panes and elements.
Trend View Properties
Highlighting any of the Trend Views in the center pane will display the following Trend View properties that control the look and feel of the Trend View selected.

Time Scale group options set the amount of time that is displayed in the current Trend View. Enter the number of Hours, Minutes, and Seconds to display in the fields provided, up to a maximum of 24 hours:
Click the Set button to change the time scale to the number of Hours, Minutes and Seconds specified, or clicking the Scale to Data button sets the number of Hours, Minutes and Seconds required to display all of the data values recorded since the Trend was started, then redraws the Trend using the new Time Scale.
Y-Scale options set the amount of data that is displayed vertically in the Trend View:
Click Auto-Scale All button to automatically determine the minimum and maximum values for the panes on the Trend View based on the element values. The Panes will re-scale if needed.
Click Scale to Data button to set the minimum and maximum values of the vertical axis required to display all of the data values recorded since the Trend View was started, then redraws the Trend using the new axis values.
Crosshair group defines how the crosshair is displayed in the Trend View:
When Show Crosshair is enabled, this option will display the crosshair any time the mouse cursor is moved over the Trend View.
Click the Color button to display a list of colors from which to choose, then click the Style button to display a list of line styles from which to choose.
View Name group specifies the name of the Trend View:
Enter up to 16 characters in the Name field then click the Set button to change the name of the Trend.
Toggle Historical Mode switches the Trend View between real-time display of the data being collected, and the Historical view of the data that has been collected since the Trend View was started.
Historical Data group sets disk storage limits for the elements on the Trend:
Click the Up or Down arrow to change the amount of disk storage allocated to each element in the Trend View then click the Set button to save the changed amount value.
Pane Display Properties
Highlighting any of the Panes in any of the Trend Views in the center pane will display the following Pane properties that control the look and feel of the one Pane that is selected.

Click the Background Color button to display a list of colors from which to choose the background color of the pane.
Click the Trending Area Color button to display a list of colors from which to choose the color of the trend area in the pane.
Grid Lines / Tick Marks group specifies the number of vertical and horizontal divisions to display on the pane.
Value Scale group defines the number of vertical divisions to display on the pane:
Click the Color button to display a list of colors from which to choose.
Click the Style button to display a list of line styles from which to choose.
Lines sets the number of equally-spaced horizontal lines to draw on the pane; enter a value or click the Up or Down arrow to change the value, then click the Set button to redraw the pane using the new value.
Ticks sets the number of equally-spaced subdivision marks between each horizontal line to draw on the pane; enter a value or click the Up or Down arrow to change the value, then click the Set button to redraw the pane using the new value.
Time Scale group sets defines the number of horizontal divisions on the pane.
Click the Color button to display a list of colors from which to choose.
Click the Style button to display a list of line styles from which to choose.
Lines sets the number of equally-spaced vertical lines to draw on the pane; enter a value or click the Up or Down arrow to change the value, then click the Set button to redraw the pane using the new value.
Ticks sets the number of equally-spaced subdivision marks between each vertical line to draw on the pane; enter a value or click the Up or Down arrow to change the value, then click the Set button to redraw the pane using the new value.
Left Axis groupspecifies the minimum and maximum values that will be displayed on this pane:
Enable Auto-Scale Left Axis to auto-scale the pane based on the values of the elements in the pane. If this is NOT checked, enter the axis values below.
Maximum sets the maximum value to display on this pane. Minimum sets the minimum value to display on this pane. Click Apply to redraw the pane using the new Maximum and Minimum values.
If there are multiple elements in the pane, they can be drawn relative to the left-side axis or the right-side axis. The Right Axis group options defines the minimum and maximum values for elements drawn relative to the right-side axis.
Enable Auto-Scale Right Axis to auto-scale the pane based on the values of the elements that are designated to use the right-side scale. If this is NOT checked, enter the axis values below.
Maximum sets the maximum value to display on this pane. Minimum sets the minimum value to display on this pane. Click Apply to redraw the pane using the new Maximum and Minimum values.
Show Element Labels enables and disables the display of the element name on the right side of the pane.
Element Graphing Properties
Highlighting any of the elements in any of the panes in any of the Trend Views in the center pane will display the following Element Graphing properties that control the look and feel of the one Pane that is selected.

Trace Attributes group defines how the trace lines of the elements will be displayed on the pane:
Click the Color button to display a list of colors from which to choose.
Click the Line Width button to display a list of line widths from which to choose.
If the pane is being drawn with separate scales for the left-side and the right side leaving the Use Right Axis unchecked will draw the trace line relative to the left-side scale; checking the box will draw the trace line relative to the right-side scale.
Discrete Options group specifies additional options for discrete memory locations:
'On' Label allows up to 16 characters to display along the right axis if the discrete memory location is ON.
'Off' Label allows up to 16 characters to display along the right axis if the discrete memory location is OFF
Click the Apply button to use the label text only for the highlighted discrete memory location or click the Apply to All button to use the label text for all of the discrete memory locations on all of the Trend Views.
Historical Data group sets disk storage limits for the selected element:
Click the Up or Down arrow to change the amount of disk storage allocated to store values for this element.
Click the Set button to save the changed amount value.
Global Options for All Trend Views
The Trend View Global Options dialog is opened by right clicking anywhere on the Trend and selecting Options for All Trend Views..., or by clicking View -> Options from the menu bar and selecting the Trend tab.

Apply Options to selects which Views
will be affected by changes to this dialog:
-
Current View means any changes made will only apply to the currently open Trend View.
-
All Open Views means if there are more than one open Trend Views, any changes made will apply to all of the open Trend Views.
-
New Views means any changes made will apply to the currently open Trend View, and any Trend View that is opened later.
Export / Logging Options sets the defaults used in the Export and Logging functions.
Enable the Specify decimal places for floating point data option to override the default handling of the number of decimal places displayed for floating point values and always display the same number of decimal places as selected.
Delimiter
designates what character will be used to separate the individual elements
on each exported line of data. The default is a comma between each element
on a line.
Enclose in Quotes designates which elements need to be enclosed in double-quotes:
Date / Time will enclose both the Date and the Time in double quotes, for example: "2012/5/17","09:36:43.456",MyPID.PV,0.35
Element will enclose only the Element in double quotes, for example: 2012/5/17,09:36:43.456,"MyPID.PV",0.35
Value will enclose only the Value in double quotes, for example: 2012/5/17,09:36:43.456,MyPID.PV,"0.35"
Export / Logging
Method specifies the format of the output data:
-
Log values for each element on a specified time interval will generate an entry in the output file for all of the values in the Trend View at the specified time interval. Use the Minute / Second / Millisecond fields to specify the time interval.
-
Log the value of each element only when it changes will only generate an entry in the output file for a single element each time that it changes value.
Historical
Data determines the amount of memory limit for saving trend data
if Historical Trend Mode is enabled.
-
How much data do you want to retain (per element)? specifies how much system RAM to allot for saving the data of each data point on the Trend View.
Each data point consumes 13 bytes of data when it is stored, so, as a general rule, 1 Mb of memory will retain about 65,536 individual data points. The maximum amount of storage allowed is 10 Mb per data point. If the storage limit is reached, the oldest data points will be replaced 32 points at a time.
A new data point is saved any time the value of that point changes, which means that data points whose value is changing rapidly will use up the storage limit at a higher rate than data points whose value is changing less often.
Prefer Nicknames to Element Names - if the elements being exported have Nicknames assigned to them, the Nicknames will be in the export file instead of the element. For example, if C13 has the nickname "Low Low Alarm", the exported lines for this data point would be "2012/5/17","12:02:54.819","Low Low Alarm","off"
Show Text on Toolbars - normally the Trend View toolbar buttons have text associated with them. If this is unchecked the text is removed from the buttons so that they only show the symbol. This allows more vertical space in the display if needed. For example:

Instead of...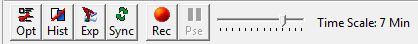
See Also:
Trend View Display Options
Related Topics: