Topic: DMD0211
Using the Debug View
The Debug View is used to manage the debug operations in the Do-more controller. Debug operations only affect the ladder logic processing, the other activities of the controller such as handling external communications, reading and writing the I/O, etc. are unaffected.
Warning: because the Debug mode operations interrupt the normal ladder logic processing in the Do-more controller it is imperative that the programmer understands all of the risks and responsibilities inherent in manually taking control of the scan process.
The Debug View is opened by clicking the Debug button on the Online toolbar or selecting the Debug-> Debug View menu selection.
The Debug operations will have no effect unless the controller is in
RUN mode. Click the Debug button
to enable and disable the debug mode and the availability of the debug
operations. The status bar will change from 'Debug
Disabled' to
Manually Control the Scan (Pause, Single Scan, N-Scans)
Placing the Do-more controller into Debug mode allows the programmer to take manual control of the scan using the following four operations:
Pause - click the Pause button to stop the controller from running the scanning. When Paused, the controller will stop reading and writing I/O and stop executing the ladder logic in the code-blocks of the project. The status bar will change from 'Scanning (scan time xxx us)' to
Paused .
Scan - click the Scan button to have the controller start scanning again after a Pause, Single Scan or N-Scan operation, that is, it will resume continuously reading and writing I/O and executing the ladder logic in the code blocks of project. The status bar will change back to 'Scanning (scan time xxx us)'.
Single Scan - click the Single Scan
The controller will make one pass through all of the enabled code-blocks, reading and writing I/O and executing the ladder logic that would normally be processed on that scan, then stop with the controller in Pause mode. button to have the controller run one complete scan then Pause. The controller will make one pass through all of the enabled code-blocks, reading and writing I/O and executing the ladder logic that would normally be processed on that scan, then stop with the controller still in the
Paused state. The status bar will change from 'Scanning (scan time xxx us)' to Paused after the one scan has completed.
N-Scan - enter the number of scan in the field provided then click the N-Scan
The controller will make the number of specified passes through all of the enabled code-blocks, reading and writing I/O and executing the ladder logic that would normally be processed on those scans, then stop with the controller still in Pause mode. button to have the controller run the number of specified scans. The controller will make the number of specified passes through all of the enabled code-blocks, reading and writing I/O and executing the ladder logic that would normally be processed on those scans, then stop with the controller still in the
Paused state. The status bar will change from 'Scanning (scan time xxx us)' to Paused after the specified number of scans have completed.
Manually Enable and Disable Stages
Click the Stages... button to invoke the Enable / Disable Stage dialog to manually enable and/or disable a Stage contained in a Program code-block of a project. The Enable Stage and Disable Stage operations here work like the Enable Stage (SGSET) and Disable Stage (SGRST) instructions respectively.
Stage Name: - Debug View operates at a Project level so the programmer must enter the fully qualified name of the Stage to Enable or Disable. A fully qualified name consist of the <Program Name>.<Stage Number>. Entering just the Stage number is not valid.
Nickname: - will display the nickname of the Stage if one exists.
The Status group displays the latest scan status of the Program and the Stage to be enabled or disabled.
Program Status: - indicates whether or not the Program was running on the last controller scan.
Stage Status: - indicates the current state (Enabled / Disabled) of the specified Stage.
Click the Enable button to Enable the specified Stage.
Click the Disable button to Disable the specified Stage.
Click the Close button to Exit the dialog.
Enable Debug Message Logging
Click the Message Dump button to enable the logging of the debug messages to the Network Message Viewer (Do-more Logger) application. The predefined system status bit $EnableMsgDump (ST36) is set ON, and from that time forward, whenever the Do-more controller generates a new ERR (system error message) or a new MSG (system notification) the controller will echo them to the Do-more Logger.
Disabling the Message dump will reset $EnableMsgDump.
If the Do-more Logger isn't running when the Message Dump button is clicked, the programmer will be prompted to launch it. Click the 'Remember my choice' option to skip this confirmation dialog the next time the Message Dump button is clicked.
Manually Force a Watchdog Error
Click the Watchdog... button to invoke a dialog that allows the programmer to test the Hardware Watchdog Timer and the Software Watchdog Timer functions.
Note: it is imperative that the programmer be fully aware of the implications of testing either of these Watchdog Timer before performing the test.
Click the OK button to generate the selected watchdog timeout error.
Click the Cancel button to exit.
As a safety precaution this confirmation dialog will be presented before the Software Watchdog Timeout is generated:
Click the Yes button to generate the Software Watchdog Timeout
Click the No button to exit..
As a safety precaution this confirmation dialog will be presented before the Hardware Watchdog Timeout is generated:
Click the Yes button to generate the Hardware Watchdog Timeout.
Click the No button to exit.
Manually Suspend and Unsuspend Tasks and Programs
The Suspended Tasks / Programs group is used to override programmatic control of whether a Program or Task will run as part of the current controller scan. Program or Task code-blocks that are suspended through this debug mode operation or by the Suspend Program or Task (SUSPEND) instruction will be displayed with a yellow background in the Project Browser.
Code blocks with an 'I' to the left of their name indicates it has been suspended by a SUSPEND instruction.
Code blocks with an 'D' to the left of their name indicates it has been suspended by the Debug View.
Code blocks with both a 'D' and an 'I' to the left of their name indicates it has been suspended by a SUSPEND instruction and the Debug View.
Unsuspend - use the mouse to select one of the Programs or Tasks in the list then click this button to unsuspend the currently highlighted code-block.
Unsuspend All - click this button to unsuspend all of the Programs or Tasks that have been suspended by the Debug View. Note: this does NOT affect Programs or Tasks that are suspended by a Suspend Program or Task (SUSPEND) instruction.
Include programmatically suspended items - click this box to add code-blocks to this list that have been suspended by a Suspend Program or Task (SUSPEND) instruction.

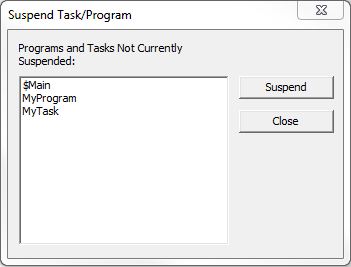
Suspend ... - invokes a dialog that contains a list of the Programs and Tasks that are currently NOT suspended. To suspend a Program or Task, highlight the code-block name in the list and click the Suspend button. That code-block will be added to the Suspended Tasks/Programs list with a 'D' to it's left (the 'D' indicates Debug Suspended), and the code-block name will be displayed with a yellow background in the Project Browser.

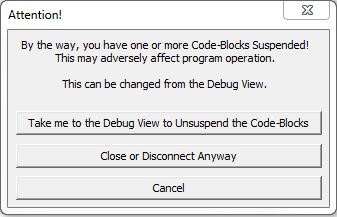
When the Do-more Designer project is closed, or if the online session is closed (PLC ->Disconnect), and there are any Program or Task code-blocks that are still debug-suspended, this dialog will be displayed:
Take me to the Debug View to Unsuspend the Code-Blocks - will reopen the Debug View so that any debug-suspended code-blocks can be unsuspended.
Close or Disconnect Anyway - continue with the Close Project or Disconnect operation leaving the code-blocks suspended.
Cancel - stops the Close Project or Disconnect operation.
See Also:
Making
Effective Use of Programs and Tasks
