Topic: DMD0244

The PID View
The PID View is where the majority of the work related to configuring, tuning, and monitoring PID loops will be done. The PID View is opened by selecting Debug-> PID View from the Online Toolbar, or right-clicking on any PID instruction in a ladder diagram and selecting Trend Instruction from the pop-up menu, or double-clicking on the PID Overview graphic for that PID loop.
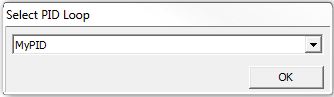
If the project contains more than one Closed Loop Controller (PID) instruction the PID View dialog needs to know which PID loop to display in the view. The Select PID Loop dialog will contain a list of the PID loops in the project, select the loop to display from the list.
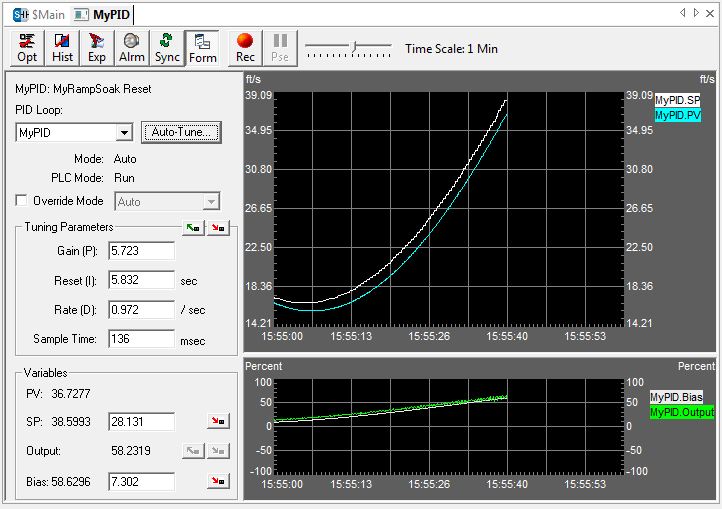
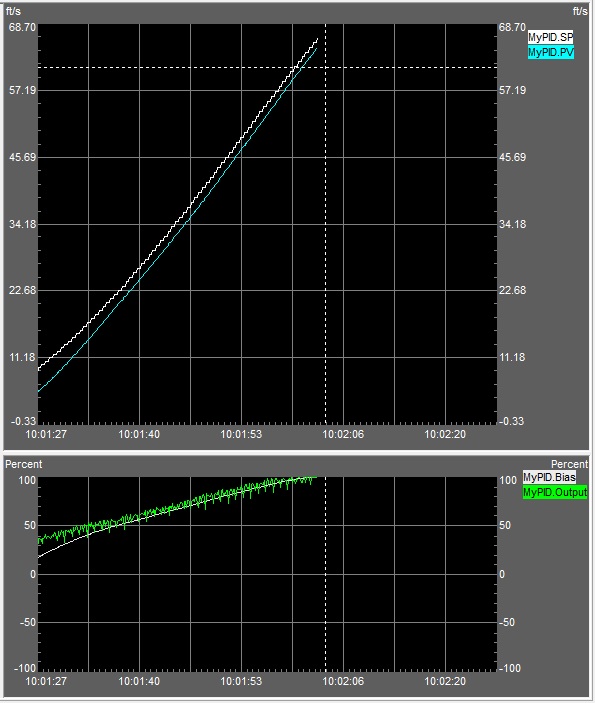
The PID View is broken into three sections: one down the left side (the PID Data form) that displays the current configuration of the underlying PID Loop, and on the right side there are two trend graphs (one with the .PV and .SP fields, and one with the .Output and .Bias fields).
Entries in PID Data Form
PID Struct - The text displayed in the upper left corner is the Struct name of the current PID loop. If the Setpoint of that PID Loop is being driven by a Ramp/Soak Profile, the Struct name of that Ramp/Soak profile along with the current step in that profile will be displayed.
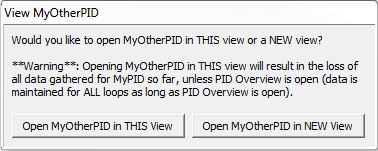
PID Loop: - selects which PID Loop to display. If one or more PID View tabs are already open, the following dialog will be displayed. This dialog allows the new PID view to be opened in one of two ways:
Open <PID Struct> in THIS View - the new PID Loop data will be loaded into the currently open PID View. If this option is selected all logging and trending data for the currently displayed PID Loop will be lost.
Open <PID Struct> in NEW View - an additional tab will be added for the new PID Loop data.
Auto-Tune ... - will open the dialog to initiate an Autotune cycle for the currently selected PID Loop. The Autotune process is explained in more detail in the Using the Auto-tune Process help topic.
Mode: - displays the mode of the currently selected PID loop (Auto / Manual / Override Auto / Override Manual)
PLC Mode: - displays the current mode of the controller (Run / Program / Debug).
Override Mode - the checkbox enables and disables the Override option. Override mode allows the PID View to change the loop's mode (Auto / Manual) independent of the input leg to the Closed Loop Controller (PID) instruction. If Override is enabled (checked) the drop-down list will allow the user to select between Auto and Manual mode.
In Override Auto mode the loop runs the PID calculation to generate new. Output value every Sample Time interval.
In Override Manual mode the loop IS NOT running the PID calculation, meaning the .Output value remains unchanged by the loop.
Note: It is expected that an operator or other intelligent source is manually controlling the output by observing the PV and writing data to .Output as necessary to keep the process under control.
Tuning Parameters - this group displays the current values for Gain (P), Reset (I), Rate (D), and the Sample Time (ms).
The 'Load from PLC' and 'Save to PLC' buttons allow for runtime monitoring and changing of these values. All 4 of the values will be read from the controller or written to the controller when you select 'Load From PLC' or 'Save to PLC' operations.
Variables - this group displays the current values for the Process Variable (PV), Setpoint (SP), the Output value, and the Bias value.
The 'Load from PLC' and 'Save to PLC' buttons are primarily for managing these values when the loop is in Manual mode.
PID View Toolbar Button Descriptions
The PID View contains it's own toolbar with buttons that are specific to the PID View and PID configuration and troubleshooting operations.
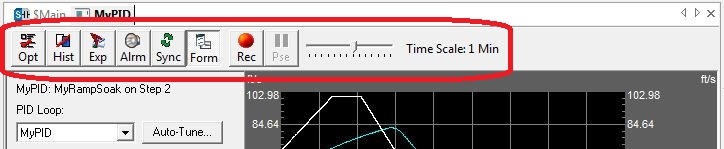
The function of each of these buttons - from left to right across the toolbar - is described below:

PID View Local Display Options
Opens the Local PID Options dialog that specifies how the Time Scale Slider works, and how the PV/SP pane is displayed:
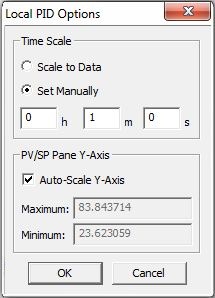
Time Scale
- specifies how the Time Scale is set
Scale to Data - changes the scale based
on how often the data is changing
Set Manually - sets the scale to the fixed value set in the Hours/Minutes/Seconds fields
PV/SP Pane Y-Axis - determines how the scale of the Y-Axis of the PV/SP Pane is set
Auto-Scale Y-Axis checked - the Y-Axis will change based on the values of the Process Variable (PV) and the Setpoint (SP).
The upper end of the scale will be set to the maximum value of any input plus an additional 5%.
The lower end of the scale will be set to the minimum value of any input minus an additional 5%.
Auto-Scale Y-Axis not checked - the lower scale value and the upper scale value are manually entered in the Maximum and Minimum fields.

Toggle Historical Mode
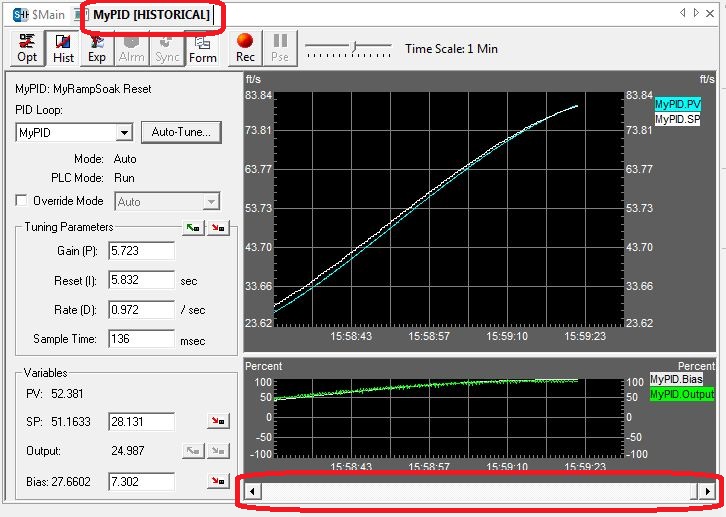
Stops the real-time (live) update of the trend displays, and adds a scroll bar to the bottom of the trend panel that allows the user to scroll backwards in time through all of the data that is currently stored for each of the data points on the displays.
The data gathering for each data point on the trend displays will continue while the PID View is in historical mode.
When the PID View is in historical mode the Tab name will have the word [HISTORICAL] added to it.
Clicking the button again will re-enable the real-time (live) update of the trend displays, and the trend graphs will be updated with all of the data that was gathered while the displays were in historical mode.

Export PID Loop Data
Opens a dialog used to export the values that are currently stored for each data point currently being displayed on the trends. All of the accumulated data points, or only the data points between two user-selected time stamps can be exported. Below is a sample of what the exported data will look like with the default export options:
"2012/5/17","13:52:37.047","MyPID.PV","0.35"
"2012/5/17","15:48:02.160","MyPID.SP","0.62"
"2012/5/17","13:35:23.088","MyPID.Bias","0.035"
"2012/5/17","13:39:19.472","MyPID.Output","0.73"
"2012/5/17","12:02:54.819","C10","off"
"2012/5/17","12:02:54.819","C11","off"
"2012/5/17","12:02:54.819","C12","off"
"2012/5/17","12:02:54.819","C13","off"
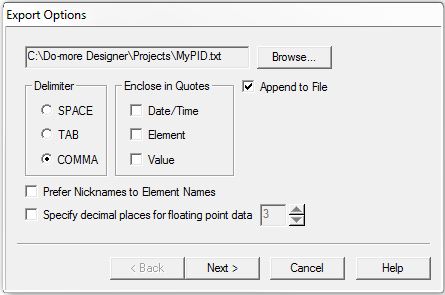
File Name - selects the name of the file in which to store the export data. The default file name will be <PID Struct>.txt. You can change the name or select an existing file by clicking the "Browse ..." button and the resulting File Open dialog.
Append to File - specifies whether to append the export data to the file, saving the existing contents of the file, or to over-write the existing contents in the specified file. This option will be enabled automatically any time the specified file already exists.
Delimiter - designates what character will be used to separate the individual elements on each exported line of data. The default is a comma between each element on a line.
SPACE - insert a space between each element
TAB - insert a tab between each element
COMMA - insert a comma between each element (default)
Enclose in Quotes - designates which elements need to be enclosed in double-quotes
Date/Time - enclose both the Date and the Time in double quotes, for example: "2012/5/17","09:36:43.456",MyPID.PV,0.35
Element - enclose only the Element in double quotes, for example: 2012/5/17,09:36:43.456,"MyPID.PV",0.35
Value - enclose only the Value in double quotes, for example: 2012/5/17,09:36:43.456,MyPID.PV,"0.35"
Prefer Nicknames to Element Names - if the elements being exported have nicknames assigned to them, the nicknames will be in the export file instead of the element. For example, if C13 has the nickname "Low Low Alarm", the exported lines for this data point would be "2012/5/17","12:02:54.819","Low Low Alarm","off"
Specify decimal places for floating point data - enable this option to override the default handling of the number of decimal places displayed for floating point values and always display the same number of decimal places as selected.
Select Time Range - designates how much data to export, this can be either all of the data accumulated since the PID View was opened, or a range specified by a start time and an end time.
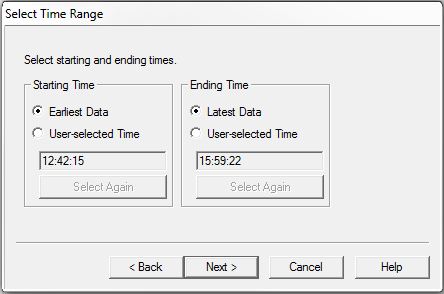
Start Time - specifies the beginning
of the data to export
-
Earliest Data - start exporting from the beginning of when the PID View started accumulating the data points
-
User Selected Time - start exporting data from the time specified by using the scroll bar to move the trend to the desired time and left-click on the trend to set the time. The left-click will place a vertical bar on the trend with a 'S' at the top denoting the start time.
-
Select Again - will remove the current Starting Time and allow the selection of a different Starting Time
Ending Time - specifies the
end of the data to export
-
Latest Data - export all of the data the PID View has accumulated since it was opened
-
User Selected Time - stop exporting data at a time specified by using the scroll bar to move the trend to the desired time and left-click on the trend to set the time. The left-click will place a vertical bar on the trend with a 'E' at the top denoting the ending time.
-
Select Again - will remove the current Ending Time and allow the selection of a different Ending Time
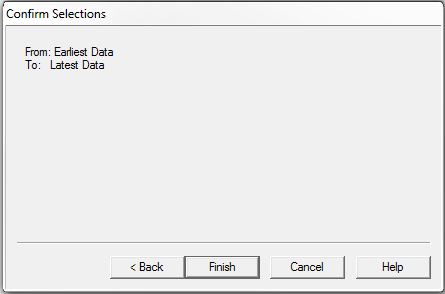
Confirm Selections - will display the range of data points to export to the file.
-
click Back to return to the previous dialog to change the export options
-
click Finish to perform the export operation
-
click Cancel to abort the export operation

Show the Alarm Pane
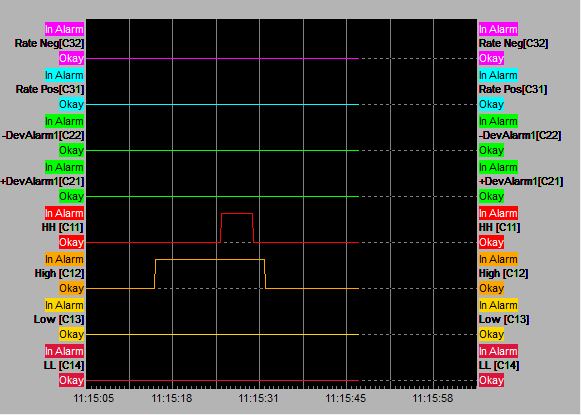
Click to add the Alarm Pane to the PID View. Any alarm monitoring instructions that are referencing the Process Variable (PV) of this PID loop will be automatically added to the Alarm Pane and the PV/SP Pane as appropriate.
High/Low Alarm - If there are any High/Low Alarm (ALHILO) instruction referencing the <PID Struct>.PV field the alarm limits from those instructions will be added to the PV/SP pane. If the Alarm Limits are constants the traces will be displayed as dotted lines, if the Alarm Limits are variable locations the traces will be displayed as solid lines in the PV/SP pane. The alarm BITs will also be added to the Alarm pane.
Deviation Alarm - If there are any Deviation Alarm (ALDEV) instructions that are monitoring the <PID Struct>.PV field, the alarm BITs from those instructions will be added to the Alarm pane.
Rate of Change Alarm - if there are any Rate of Change Alarms (ALRATE) instructions that are monitoring the <PID Struct>.PV field the alarm BITs from those instructions will be added to the Alarm pane.

Synchronize the Time Frames with Other PID Views
or Trend Views
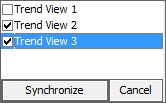
Synchronizes the time frame and the starting time stamp of multiple PID Views and/or Trend Views so that all synchronized views will display the same start time and the same amount of time.
Click the Sync button to display a list of the available PID Views and Trend Views. Select the Views from the list that are to be synchronized with the current view then click the Synchronize button.

Toggle Display of the PID Data Form
Toggles the display of the PID Data form along the left side of the Trend, Closing the Data form will maximize the size of the Trend display.
Record Current PID Loop Values
The next two buttons allow for instantaneous logging of the data point values currently being displayed on the trend graphs to disk. The recorded data is similar to that of Export Data as described above but this copy has a fixed format where each field is enclosed in double quotes and separated by commas. For example:
"2012/5/17","13:52:37.047","MyPID.PV","0.35"
"2012/5/17","15:48:02.160","MyPID.SP","0.62"
"2012/5/17","13:35:23.088","MyPID.Bias","0.035"
"2012/5/17","13:39:19.472","MyPID.Output","0.73"
"2012/5/17","12:02:54.819","C10","off"
"2012/5/17","12:02:54.819","C11","off"
"2012/5/17","12:02:54.819","C12","off"
"2012/5/17","12:02:54.819","C13","off"

Begin Recording - click this button to begin the recording session, The button face will change to a black square and the word [RECORDING] will be displayed in the dialog's tab.

Stop Recording - will stop the data recording process, and a 'Save As' dialog will prompt you for the filename in which to save the recorded data.

Pause Recording - stops recording data while the button is depressed. The button will appear depressed and the word [RECORDING - PAUSED] will be displayed in the dialog's tab. Click the button again to continue recording data, or click the cancel button to stop the recording session completely.
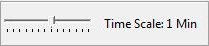
Set the Time
Scale for the Trend Graphs
Sets the overall amount of time to be displayed in the all of the open Panes. For example, if the Time scale is set to 1 Minute, the PV/SP Pane, Output, and Alarm Panes will display a total of 1 Minutes worth of data. The Time Scale can be set to the following;
-
500ms
-
1 Second
-
5 Seconds
-
10 Seconds
-
20 Seconds
-
30 Seconds
-
45 Seconds
-
1 Minute (the default)
-
2 Minutes
-
5 Minutes
-
7 Minutes
-
10 Minutes
-
30 Minutes
-
1 Hour
The Crosshair Cursor
The cross-hair is displayed anytime the mouse cursor moves over any of the panes in the PID View. The cross-hair provides a visual reference when comparing values displayed on the Panes.
If there are multiple Panes in the PID View, the vertical bar of the cross-hair will extend through all of them.
Using the Cross-hair Zoom In / Out
Using the CTRL key and the scroll wheel on the mouse will put the PID
View into Historical Mode and zoom into
or out of the area under the center of the cross-hair as follows:
Ctrl + scrolling upward will zoom into the area by decreasing the Time Scale
Ctrl + scrolling downward will zoom out of the area by increasing the Time Scale
Using the Cross-hair to Snapshot Data
Left-clicking the mouse will take a snapshot of all the values on all of the Panes on the Trend at the time where the cross-hair was located, then present that data on the snapshot dialog.
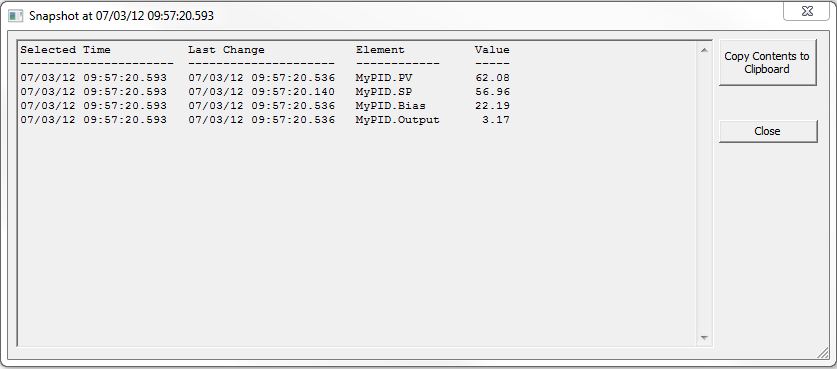
Clicking the Copy Contents to Clipboard button will copy the data displayed on the snapshot dialog to the Windows clipboard, which can then be pasted into any other Windows application for further processing.
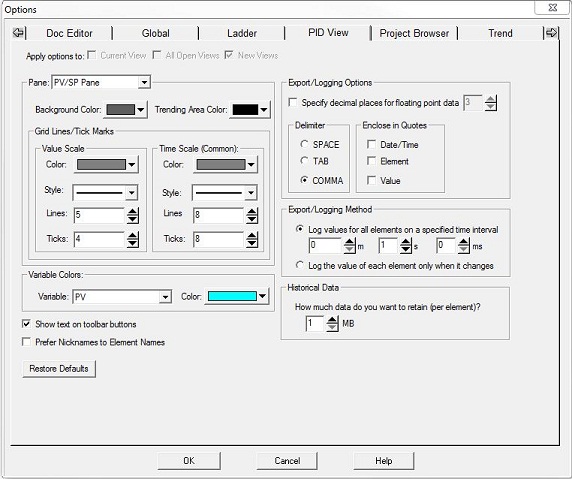
PID View Global Display Options
Allows the user to specify the colors, line styles for the trend panes in the PID View and also configure the memory usage limits for the PID View. The PID View Global Options dialog can be accessed by selecting the View -> Options from the menu then clicking the PID View tab, or selecting Global Options from the right-click menu of the PV/SP Pane.
Apply Options to - which Views
will be affected by changes to this dialog
Current View - any changes made will only apply to the currently open PID View
All Open Views - if there are more than one open PID Views, any changes made will apply to all of the open PID Views
New Views - any changes made will apply to the currently open PID View, and any PID View that is opened later
Pane - specifies which pane of the PID View to modify
PV/SP Pane
Alarm Pane
Background Color - specifies the area surrounding the trend displays
Trending Area Color - specifies the background color of the trend displays themselves
Grid Lines/Tick Marks - specifies
colors and the scale used to display the grid in the trend display area
Value Scale - specifies values for the vertical scale
Color - selects the color to use
Style - selects the line drawing width
Lines - selects the number of horizontal lines to draw
Ticks - selects the number of subdivisions for each vertical segment
Time Scale
- specifies the colors and the scale (Time) used to display the grid in
the trend display area
Color - selects the color to use
Style - selects the line drawing width
Lines - selects the number of vertical lines to draw
Ticks - selects the number of subdivisions for each horizontal segment
Variable
Colors - specifies the background color for the PID loop variables
in the PV/SP Pane and the Output Pane
-
Variable - selects which of the following PID loop variable to specify a color for:
-
PV
-
SP
-
Output
-
Bias
-
HH Alarm Limit/Bit
-
H Alarm Limit/Bit
-
L Alarm Limit/Bit
-
LL Alarm Limit/Bit
-
Color - specifies the color for the selected variable
Show Text on Toolbar Buttons - if checked, toolbar buttons will display the icon and the button name. if unchecked only the icon will be displayed.
Prefer Nicknames to Element Names - if the elements being exported have nicknames assigned to them, the nicknames will be in the export file instead of the element. For example, if C13 has the nickname "Low Low Alarm", the exported lines for this data point would be "2012/5/17","12:02:54.819","Low Low Alarm","off"
Restore Defaults - click to restore default values for all of the PID View Global options.
Export / Logging Options - defaults used in the Export and Logging functions
Specify decimal places for floating point data - enable this option to override the default handling of the number of decimal places displayed for floating point values and always display the same number of decimal places as selected.
Delimiter - designates what character will be used to separate the individual elements on each exported line of data. The default is a comma between each element on a line.
SPACE - insert a space between each element
TAB - insert a tab between each element
COMMA - insert a comma between each element (default)
Enclose in Quotes - designates which elements need to be enclosed in double-quotes
Date/Time - enclose both the Date and the Time in double quotes, for example: "2012/5/17","09:36:43.456",MyPID.PV,0.35
Element - enclose only the Element in double quotes, for example: 2012/5/17,09:36:43.456,"MyPID.PV",0.35
Value - enclose only the Value in double quotes, for example: 2012/5/17,09:36:43.456,MyPID.PV,"0.35"
Export/Logging Method - specifies the format of the output data
Log values for each element on a specified time interval - generates an entry in the output file for all of the values in the PID View at the specified time interval. Use the Minute / Second / Millisecond fields to specify the time interval.
Log the value of each element only when it changes - generates an entry in the output file for a single element each time that it changes value.
Historical
Data - designates the amount of memory limit for saving trend data
if Historical Trend Mode is enabled.
-
How much data do you want to retain (per element)? - specifies how much system RAM to allot for saving the data of each data point on the PID View.
Each data point consumes 13 bytes of data when it is stored, so, as a general rule, 1 Mb of memory will retain about 65,536 individual data points. There are 4 data points on the PID View, which means that, by default, 4 Mb of memory will be allocated for retaining historical data values.
If 'Show Alarms' is enabled, there are an additional 4 data points, for a total of 8 Mb of memory that will be used. The maximum amount of storage allowed is 10 Mb per data point.
A new data point is saved any time the value of that point changes, which means that data points whose value is changing rapidly will use up the storage limit at a higher rate than data points whose value is changing less often.
If the storage limit is reached, the oldest data points will be replaced 32 points at a time.
See Also:
Process Control Instruction Set
The PID View
Using the PID Process Simulator
Related Topics:
PID Calculation and Tuning Constants
PIDINIT - Set PID Tuning Constants
Alarm Handlers
Input and Output Value Limiters
DEADBAND - Set Outside Deadband
Noise Suppression
INTEGRAT - Integrate Over Time
Ramp/Soak Profiles - up to 250 steps per Profile
Input and Output Scaling
Analog Control using a Discrete Output
TIMEPROP - Time Proportional Control